
Computing Forest Canopy Density
To compute Forest Canopy Density, select the Forest Canopy density product from the from the forest products drop down list.
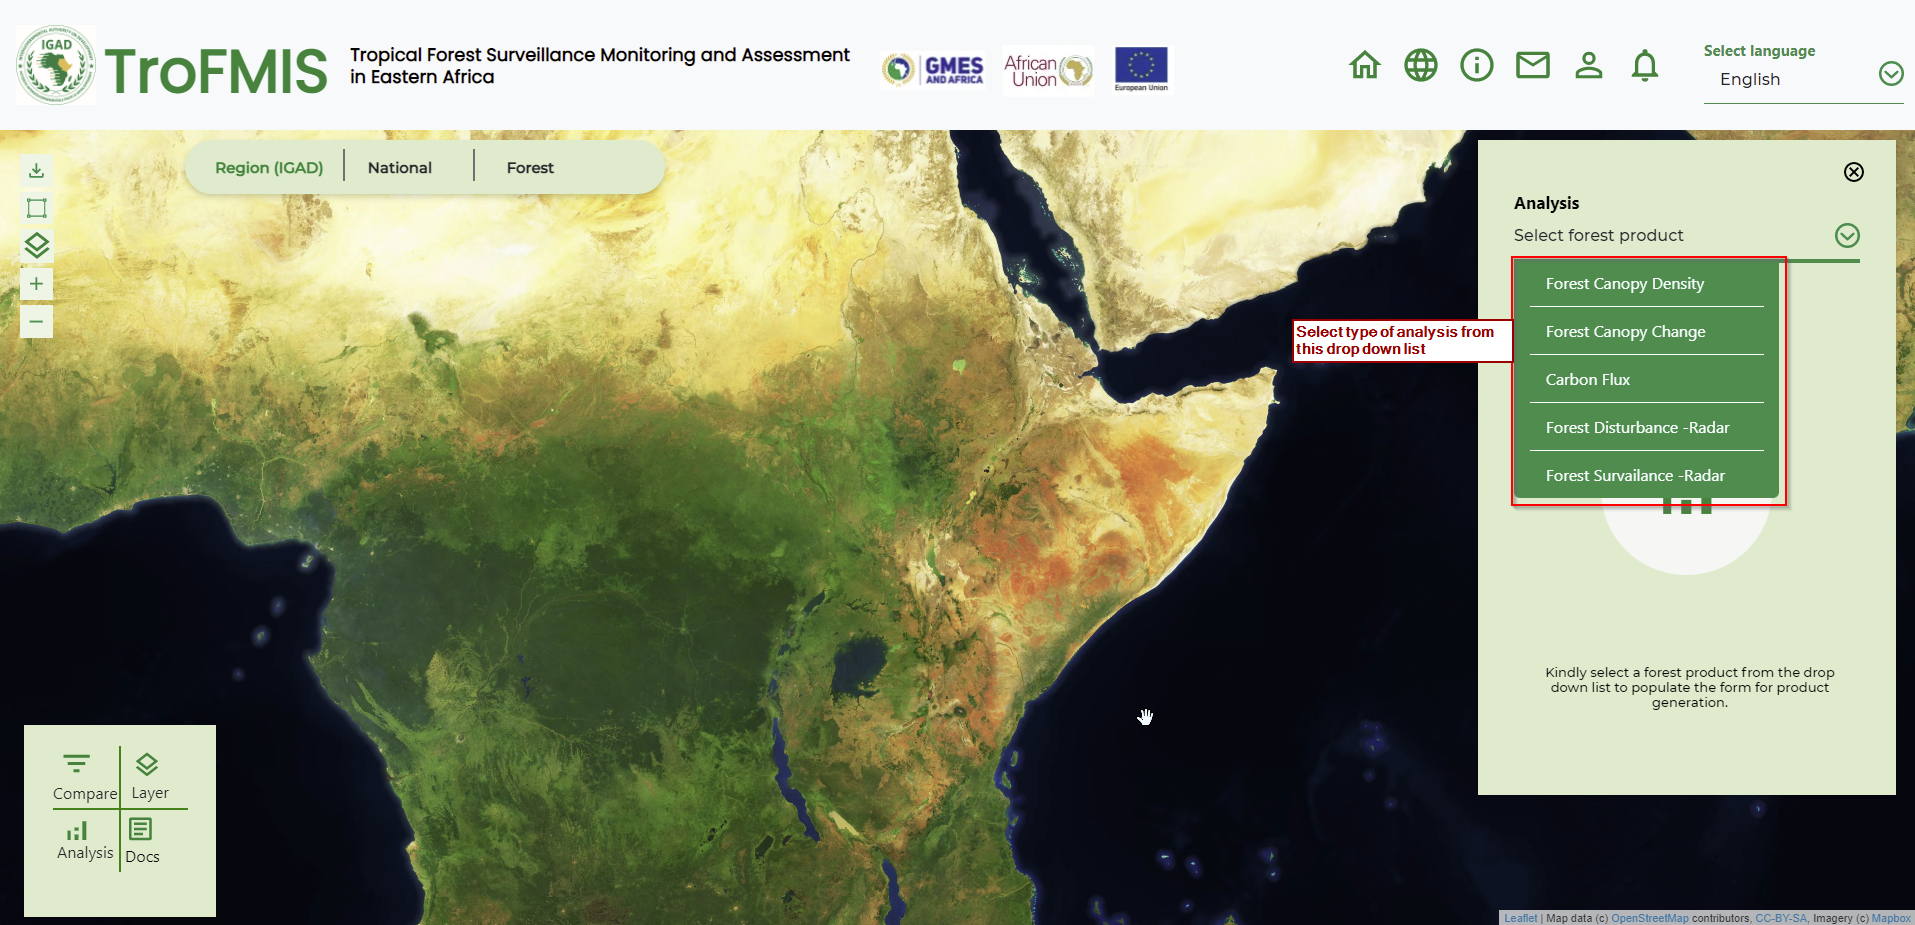
Fig. 12 System Product Selection (FCD)
2. Select the valuesattributes to fill in the form as shown in the figure below.

Fig. 13 FCD Canopy Selection in TroFMIS
Click generate to generate the map and statistics as shown in the figure below.

Fig. 14 FCD Output map
The map output incoporates some features, including
Legend: Used to interpret the map
Chart: Gives a summary statistics of class value distribution in hectares
The control buttons: Enable the user to generate another product, or compare between the layers.
The selected country and forest of interest appears in the top component as shown in the figure below.
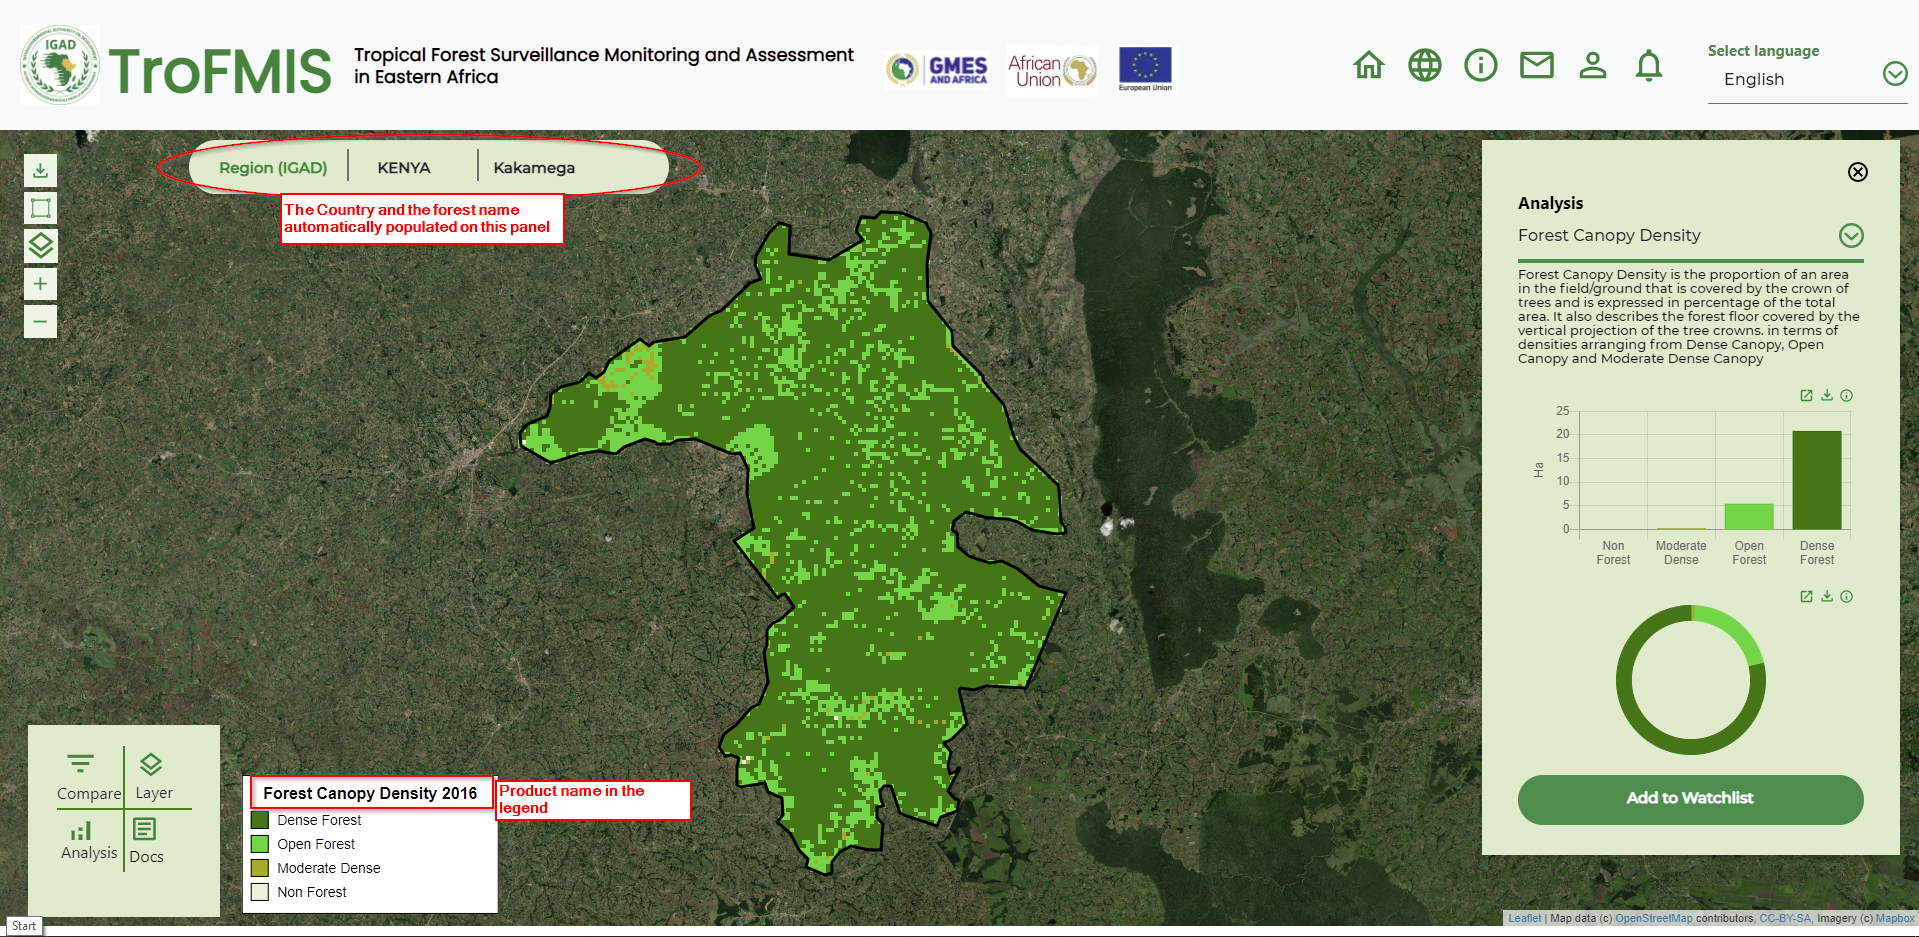
Fig. 15 Populated Area of interest in TroFMIS
To understand the product, the user has been provided with product description, statistics and additional functionalities as highlighted in the figure below.

Fig. 16 FCD description and summary statistics.